


- Ripple’s XRP has struggled to break past the $0.585 resistance level.
- XRP has experienced a downside correction against the US Dollar.
- Technical indicators such as the MACD and RSI suggest a possible downward trend.
Ripple‘s XRP has hit a roadblock after it struggled to overcome the $0.585 resistance, leading to a downside correction against the US Dollar. Despite Bitcoin and Ethereum experiencing a decent increase, XRP has been unable to keep pace with its peers.
The bulls had made a decent upward move from the $0.482 zone since Monday, the 3rd of April, propelling the price above the $0.512 resistance.
However, they could not hold above the $0.5200 resistance zone, and the price has stayed below the 50% Fib retracement level from the $0.5848 swing high to the $0.4820 low.
XRP Price Near $0.5020: Can Bulls Push It to $0.545?
As of writing, XRP is trading near $0.5020, and the 100 simple moving average (four hours) is within proximity. On the four-hour chart of the XRP/USD pair, a significant trend line is forming near $0.5065.
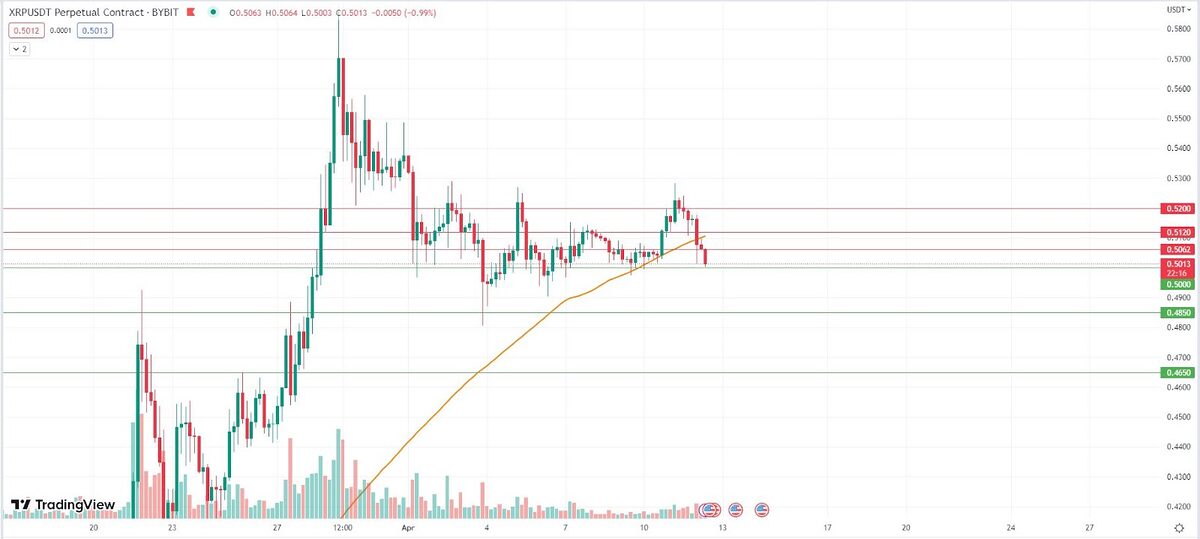
XRP/USDT Four-Hour Perpetual Contract Chart. Source: TradingView
The initial resistance is in the $0.5120 zone, with the first significant resistance near the $0.5200 level. If XRP can break above this resistance, it may send the price toward the $0.545 resistance or the 61.8% Fib retracement level from the $0.5848 swing high to the $0.4820 low. Any further gains may send the price toward the $0.585 level.
However, if XRP fails to clear the $0.520 resistance zone, it may continue to decline. The initial support on the downside is near the $0.500 zone, with the next major support near $0.485. If the price falls below the $0.484 level and closes below it, XRP’s price could extend losses and test the $0.465 support zone.
MACD & RSI Indicate XRP May Face Losses
Technical indicators reveal that the MACD for XRP/USD is now gaining pace in the bearish zone, while the RSI for XRP/USD is below the 50 level.
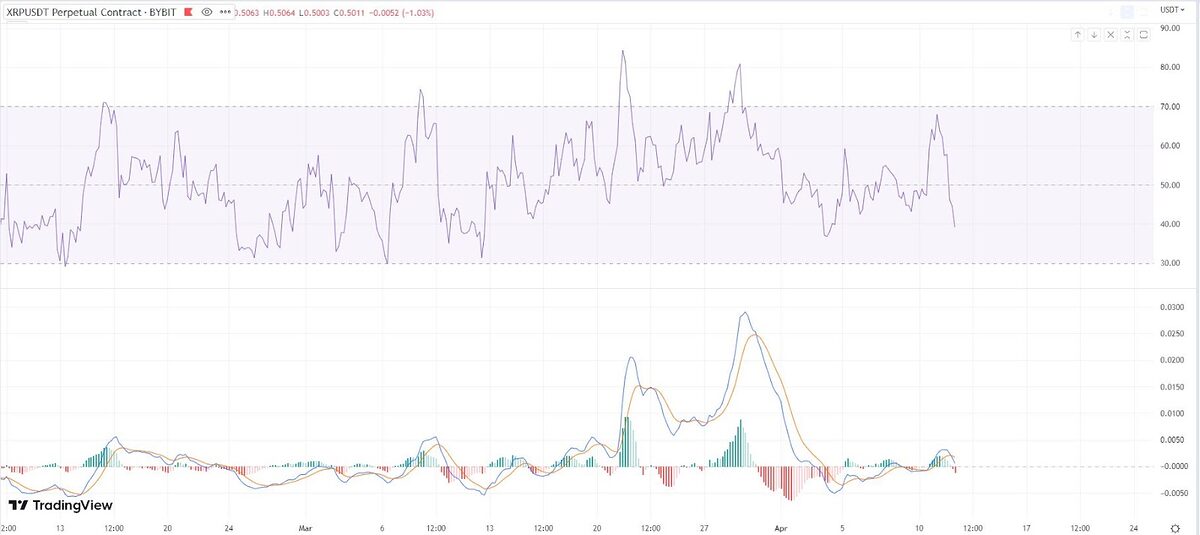
XRP/USDT RSI and MACD Charts. Source: TradingView
In summary, XRP is facing resistance at the $0.5200 level. If it fails to overcome this hurdle, it may continue to face losses, with the initial support being near the $0.500 zone, followed by the next significant support at $0.485. On the upside, the first significant resistance is near the $0.5200 level, followed by the $0.545 and $0.585 resistance levels.
On the Flipside
- Despite XRP’s recent struggles, the overall cryptocurrency market has been on an upward trend, with Bitcoin and Ethereum seeing significant gains.
- The current correction could be seen as a necessary market correction following its recent price surge of 39% in the last 30 days.
- As with all investments, predicting market trends is virtually impossible, and any decisions based on market speculation should not be construed as financial advice.
Why You Should Care
Ripple’s XRP is the sixth-largest cryptocurrency by market cap, and its performance significantly impacts the overall crypto market. Understanding the factors influencing XRP’s movement can provide insight into the broader market trends.
To learn more about the recent court ruling on Ripple’s battle with the SEC, click here:
Ripple, SEC Feud Intensifies: Court Rejects Fair Notice?
For more information on the recent surge in Solana’s value and its impact on the crypto market, read here:
Sourced from dailycoin.com.
Written by on 2023-04-12 13:50:00.


