

Amid the 2023 bear market, one can’t help but reflect on the game-changing moments that have shaped this industry.
The ‘DeFi Summer’ of 2020 was a turning point in the blockchain industry, as CryptoSlate remembers. This season saw the debut of several DeFi projects, signaling the dawn of a new era in finance. DeFi’s evolution during this period didn’t just make waves; it catalyzed a paradigm shift, positioning itself as the bold trailblazer of this unprecedented movement.
Having been around in concept since 2015 through projects such as MakerDAO, DeFi experienced a monumental surge during the bull run of 2021, redefining traditional finance and making its mark as a significant player in the market. Yet, today, with token prices down up to 90% as we navigate the murky waters of the current bear market, we look at the velocity of DeFi adoption and the impact of market cycles on adoption.
DeFi TVL analysis by chain since 2017
Against this backdrop, our analysis focuses on data collected from 2018 to 2023, with an emphasis on adoption across chains such as Ethereum, Tron, BNB Chain (BSC), Arbitrum, Polygon, Optimism, Avalanche, Mixin, Pulse, Cronos, Solana, Cardano, and Osmosis.

The table below shows the chains analyzed, the date the chain reached its all-time high for TVL (as tracked by DefiLlama,), the time it took to get its all-time high since launch (velocity), its all-time high (ATH), and the current TVL.
The chart below visualizes the velocity of each chain in reaching its all-time high in TVL. The DeFi pioneer, Ethereum, has technically had DeFi activity since 2017, and thus it stands out as the slowest adoption, given its all-time high was not reached until Nov. 2021.
Interestingly, November 2021 coincides with the all-time high for Bitcoin and likely impacted DeFi on Tron and Solana, which also saw peaks at this time.

Bitcoin adjusted velocity
As Bitcoin is seen as a barometer for the overall health of the cryptocurrency market, the velocity of DeFi adoption was adjusted based on Bitcoin’s price at each chain’s DeFi launch.
CryptoSlate cross-referenced the price of Bitcoin with the all-time high data to create a Bitcoin-adjusted velocity (BaV) for each chain.
The chart below’s grey line and plot points represent the BaV for each chain. The chart reveals that the DeFi ecosystems of Tron, Polygon, and BSC were all positively impacted by Bitcoin’s price and the supporting bullish sentiment of the market.

Analysis of chain velocity
Ethereum was removed from the above chart for readability as it recorded a massive 7,936 velocity score compared to the next closes, with Tron at 1,065 and Arbitrum at 829.
With the bear market factored in, Pulse’s velocity reduced, giving it a score of just 10.98, as it reached its ATH in just 5 days. The next lowest was Cardano at 109, some ten times greater.
Using the BaV metric, it appears the best-performing chains were Pule, Cardano, Cronos, Solana, and Osmosis. While Ethereum, Tron, and Arbitrum stood out as having the slowest velocity.
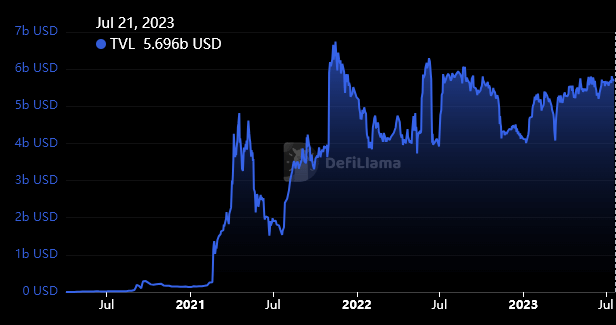
Tron is one of the chains currently closest to its ATH, with a strong performance in 2023. Should it pass its ATH of $6.47 billion from its current level of $5.6 billion, it may surpass Ethereum on the BaV and standard measures of velocity.
The diverse trajectories of DeFi adoption across different blockchain networks underscore the importance of timing, market conditions, and the inherent advantages of being an early mover in the space. However, as the remarkable case of Pulse shows, even newcomers can achieve rapid growth with the right factors aligning.
Understanding the data
The speed at which you reach the all-time high in TVL is a complex metric. Some may argue that the faster you go up, the quicker you come down, and that is definitely the case for some chains.
However, the fundamental factors under analysis here concern momentum and adoption. Further, all the projects listed recorded at least $330 million locked, with most over $1 billion. These are not projects with low market cap and low liquidity.
The projects analyzed in this article are critical to identifying the strengths and weaknesses of the historical DeFi onboarding process. The average time it took for a chain to reach its ATH was around 338 days, meaning, outliers aside, most chains take almost a year to peak in DeFi activity.
* Launch date refers to the date of the first data tracked by DefiLama for each chain**
** Using MakerDAO’s DAI launch as the date for the Ethereum DeFi launch and data according to CoinmarketCap’s historical data.
*** Additional data included due to DefiLlama 2020 cut-off date.
Sourced from cryptonews.net.