

In a surprising turn of events, the XRP price chart has displayed intriguing patterns that could foreshadow major future events for investors. With a recent breakout and retest above the $0.44 zone, coupled with a breakthrough above the 50-day exponential moving average, an inverse head and shoulders (H&S) pattern has emerged, suggesting possible upward movement in the XRP price.
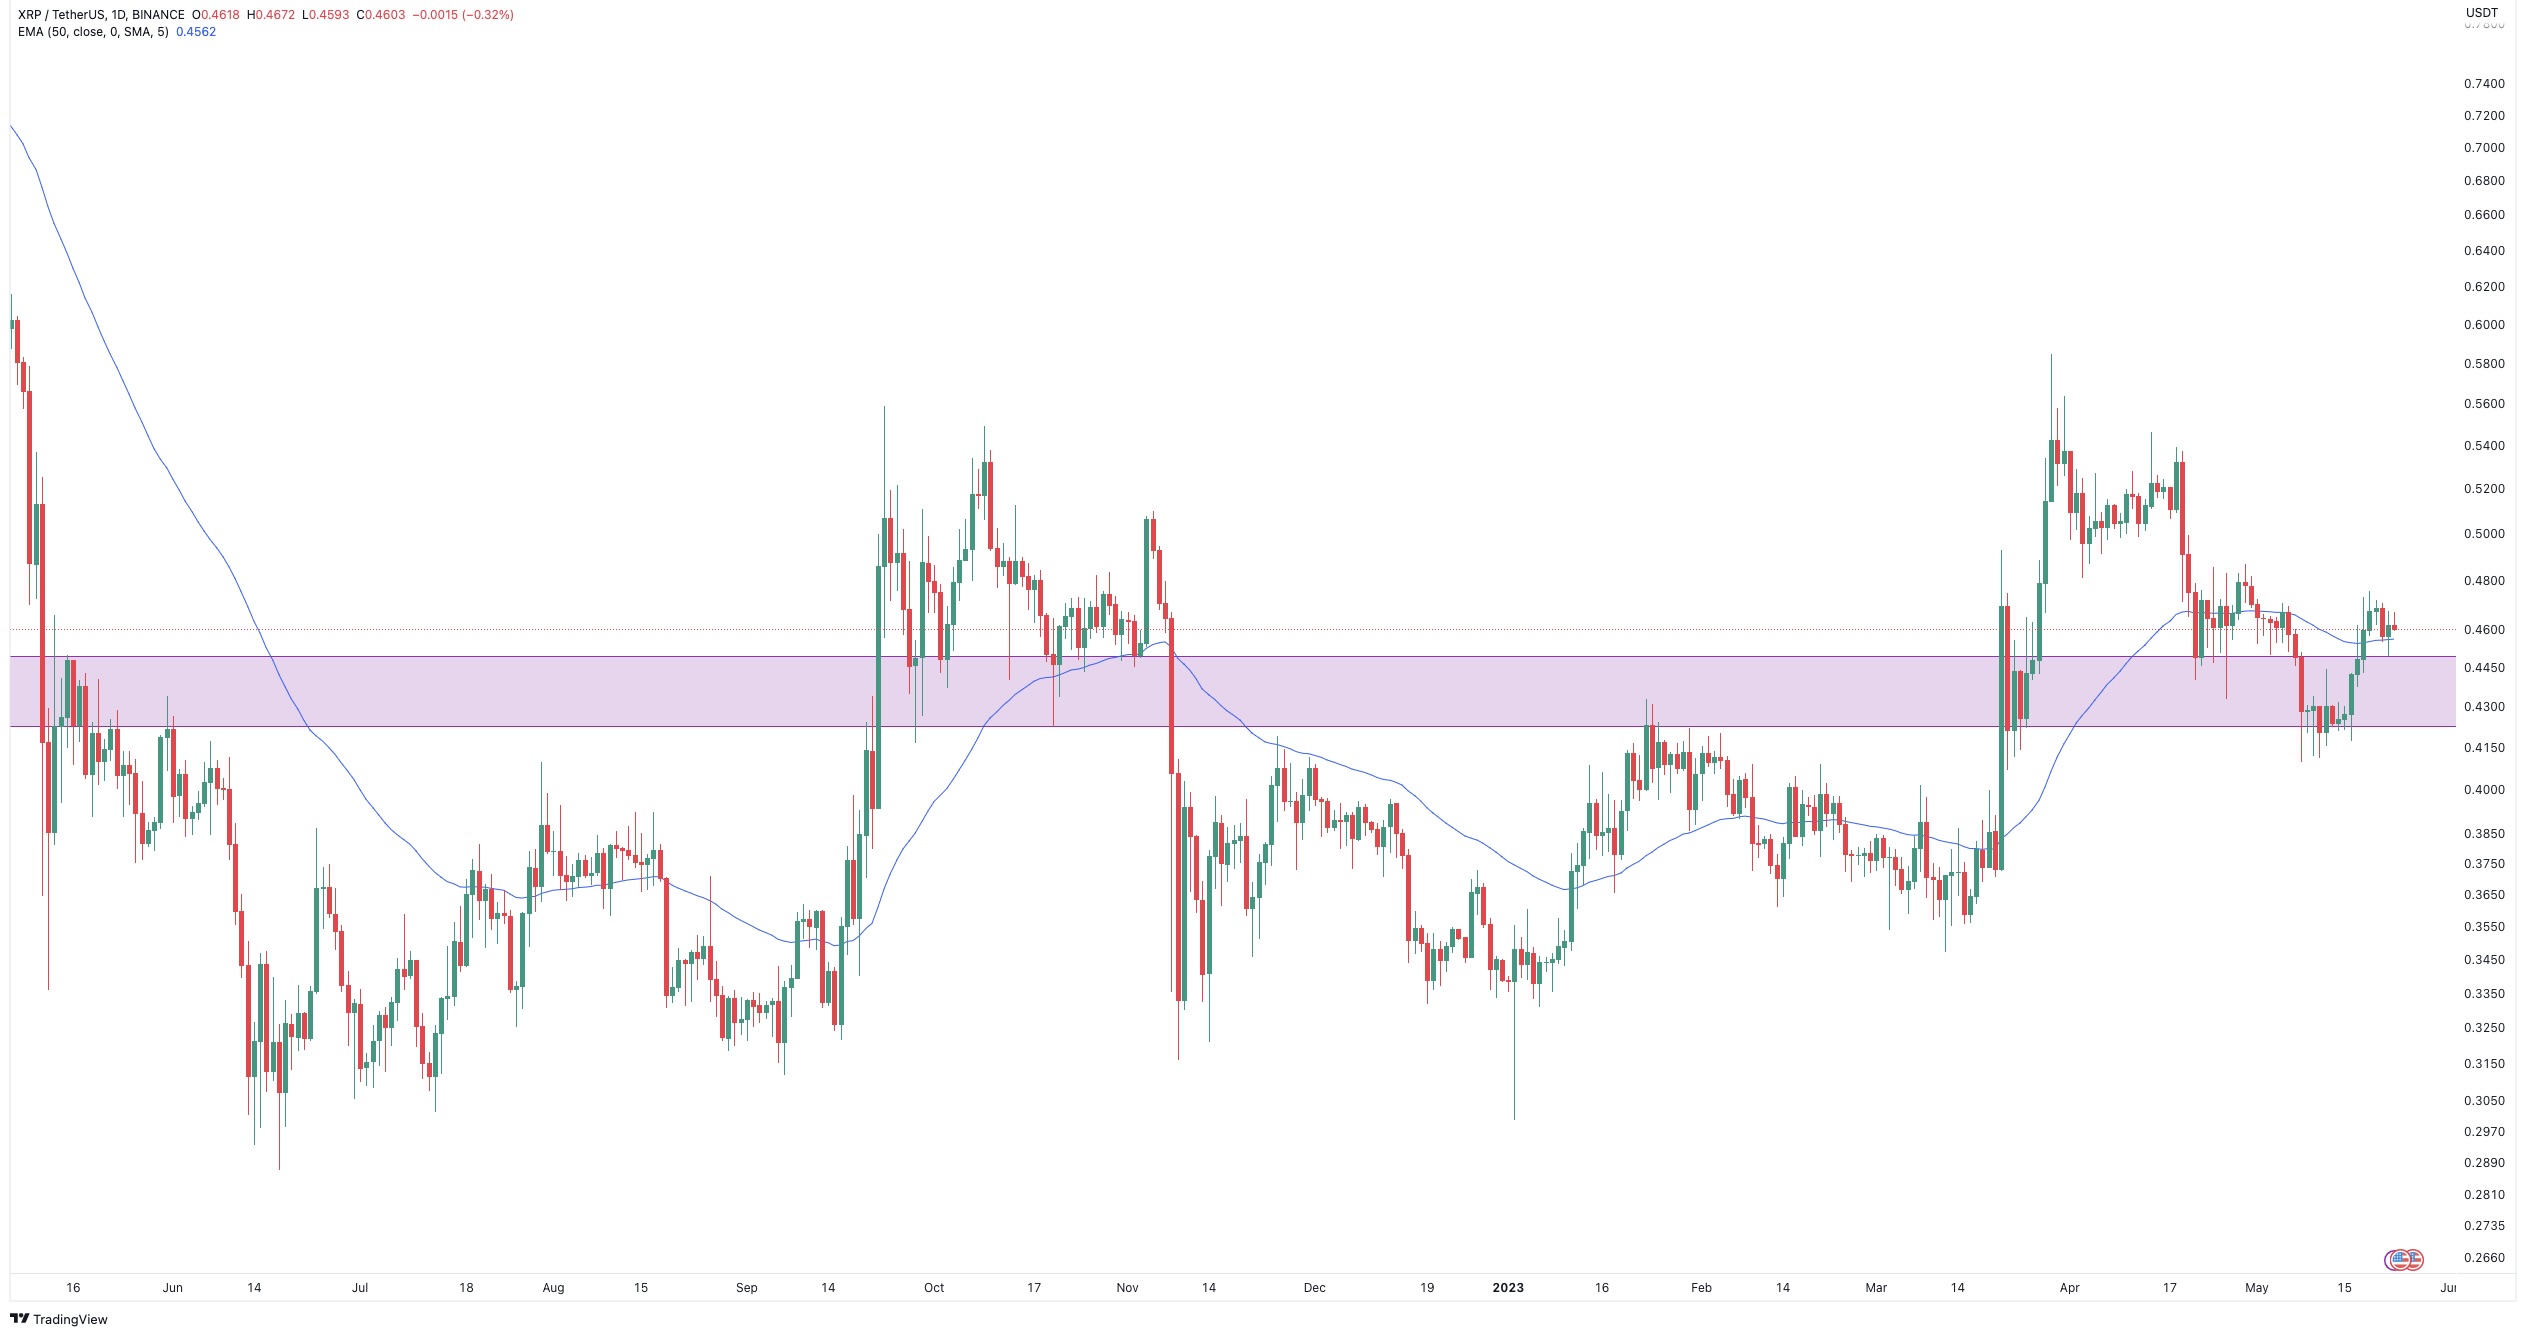
These indicators hold significance on their own, but their convergence points towards an imminent surge in XRP’s value. However, given the current market uncertainty and the lingering legal dispute between Ripple and the Securities and Exchange Commission (SEC), the formation of such bullish structures raises questions and curiosity among market participants. Could insiders and market makers be pricing in significant news that could justify a potential rise?
The last time an event of a similar magnitude occurred was in March, when investors were also betting on an imminent verdict in the SEC case against Ripple. There was particular enthusiasm from Korean investors at the time, with XRP trading volumes on key South Korean exchanges accounting for more than 30% of total turnover.
This time, however, the conjuncture is different; trading volumes and volatility have fallen as compared with the beginning of spring, and the market itself is in rather a near-depressive state. Time will tell whether or not the layout on the XRP price chart justifies itself, but perhaps the right thing to do is to maintain attention to the media field around this token.
Sourced from u.today.
Written by Gamza Khanzadaev on 2031-10-21 09:38:07.