
Ripple-affiliated cryptocurrency XRP appears to be forming a significant bullish chart pattern, suggesting a potential rise to $0.69.
Analysts and traders are closely watching this development as the ascending triangle observed on the XRP/USD price chart could signal renewed buying interest and momentum.
Targeting $0.69 level
The XRP/USD daily price chart, as highlighted by Aksel Kibar, founder of TechCharts, indicates the formation of a two-month-long ascending triangle.
This pattern is characterized by a flat upper trendline and an upward-sloping lower trendline, suggesting a consolidation phase where sellers are gradually overtaken by buyers.
Historically, an ascending triangle is viewed as a bullish pattern, often leading to a breakout above the upper trendline.
If XRP manages to surpass the $0.56 resistance level, there is potential for the cryptocurrency to reach the $0.69 target (as projected by the chart).
It шs worth noting that while this pattern has a bullish undertone, it шs essential for investors to exercise caution and ensure other technical and fundamental indicators align with this potential breakout.
XRP’s recent recovery
According to recent data from CoinGecko, XRP is currently trading at approximately $0.611866, witnessing a slight increase of 1.5% in its value.
The token has been fluctuating within a 24-hour range of $0.59 to $0.62. XRP’s market capitalization stands robust at $32.8 billion.
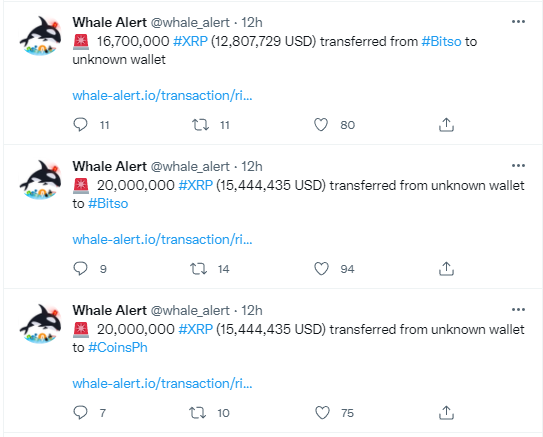
Data from Santiment indicates a rise in XRP’s price along with increased whale activity. There is also a notable increase in wallet holdings, signaling potential investor confidence or strategic positioning.
Sourced from u.today.
Written by on 2023-11-28 07:10:46.