


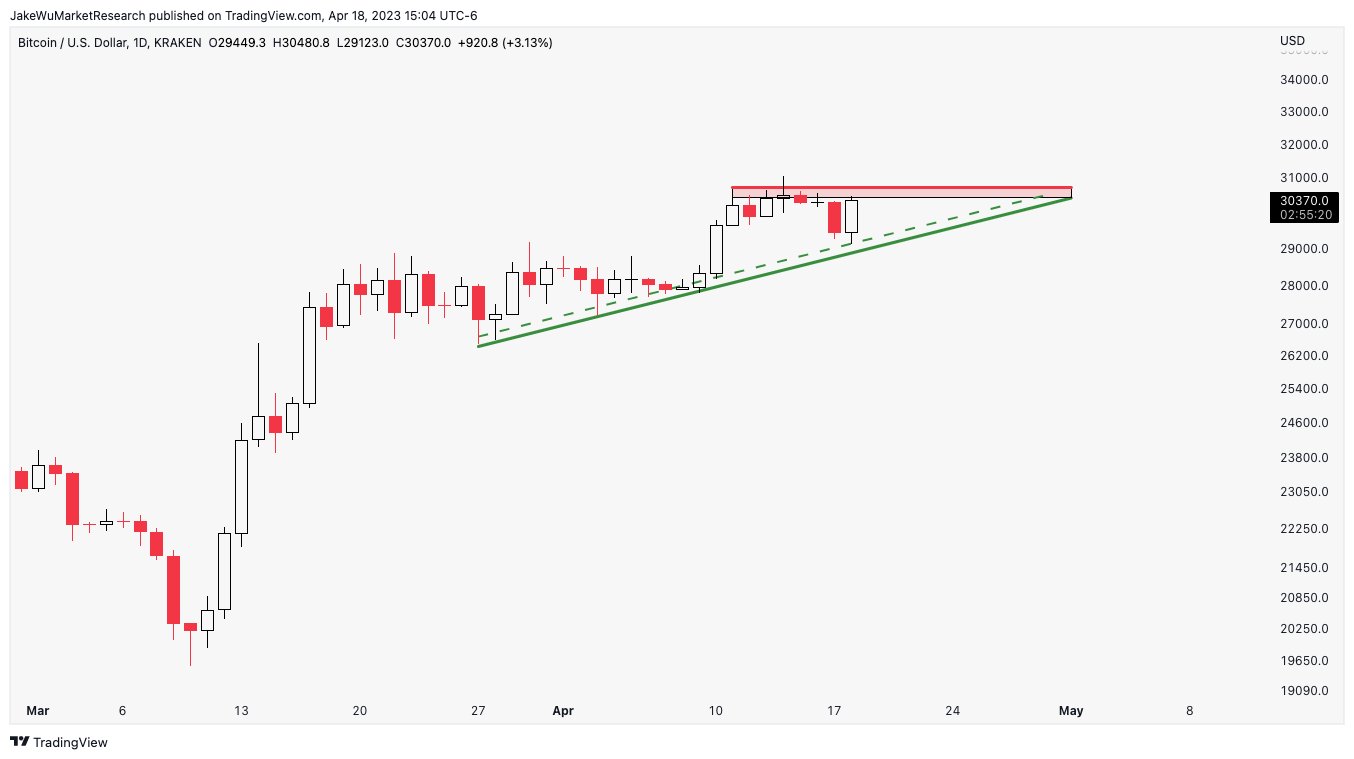
Bitcoin’s latest technical analysis reveals an ascending triangle pattern forming on the daily chart, potentially signaling a significant price breakout in the near future.
An ascending triangle is a bullish continuation pattern that typically forms during an upward price trend. It consists of a flat resistance level and a rising trendline with higher lows, indicating that buying pressure is increasing while selling pressure remains constant.
The pattern was highlighted by Jake Wujastyk, a well-known cryptocurrency analyst, on Twitter. Wujastyk’s tweet drew attention to the ascending triangle, and he further noted that this development could lead to substantial upward movement in Bitcoin’s price.
The cryptocurrency community has been closely monitoring the chart pattern for signs of confirmation, as many traders rely on these technical indicators to predict market trends and make informed decisions.
If Bitcoin’s price breaks above the ascending triangle’s resistance level, it could trigger a wave of buying that propels the cryptocurrency to new heights. However, as with any technical analysis, there is no guarantee that the pattern will play out as predicted.
Despite the optimism surrounding the ascending triangle, traders must remain vigilant and consider other factors such as market sentiment, global economic conditions and regulatory developments that could also impact Bitcoin’s price trajectory.
The price of the largest cryptocurrency is currently sitting at $29,509, down 2% over the past 24 hours.
Sourced from u.today.
Written by Alex Dovbnya on 2031-10-21 09:38:07.