
Analytics
beincrypto.com
24 October 2022 09:30, UTC
Reading time: ~3 m
Solana (SOL) price has reclaimed a minor support area and could break out from its descending resistance line soon.
SOL has been falling since reaching an all-time high price of $259.90 in Nov. 2021. The downward movement has led to a minimum price of $25.86 in June 2022.
While the Solana price bounced afterwards, it has returned towards its lows once more, potentially creating a double bottom pattern. The double bottom is considered a bullish pattern, meaning that it could lead to a bullish reversal.
While the weekly RSI is in the process of generating bullish divergence, that has yet to be confirmed. So, the confirmation of the bullish pattern and the bullish divergence would be sufficient to predict a reversal.
Conversely, it is worth mentioning that the SOL price has not yet reached an important support area. The main horizontal support area is at $22, created by the wick lows of April to Aug. 2021 (green icons).
Therefore, the weekly time frame for Solana provides a mixed outlook, failing to lead to a convincing SOL price prediction.
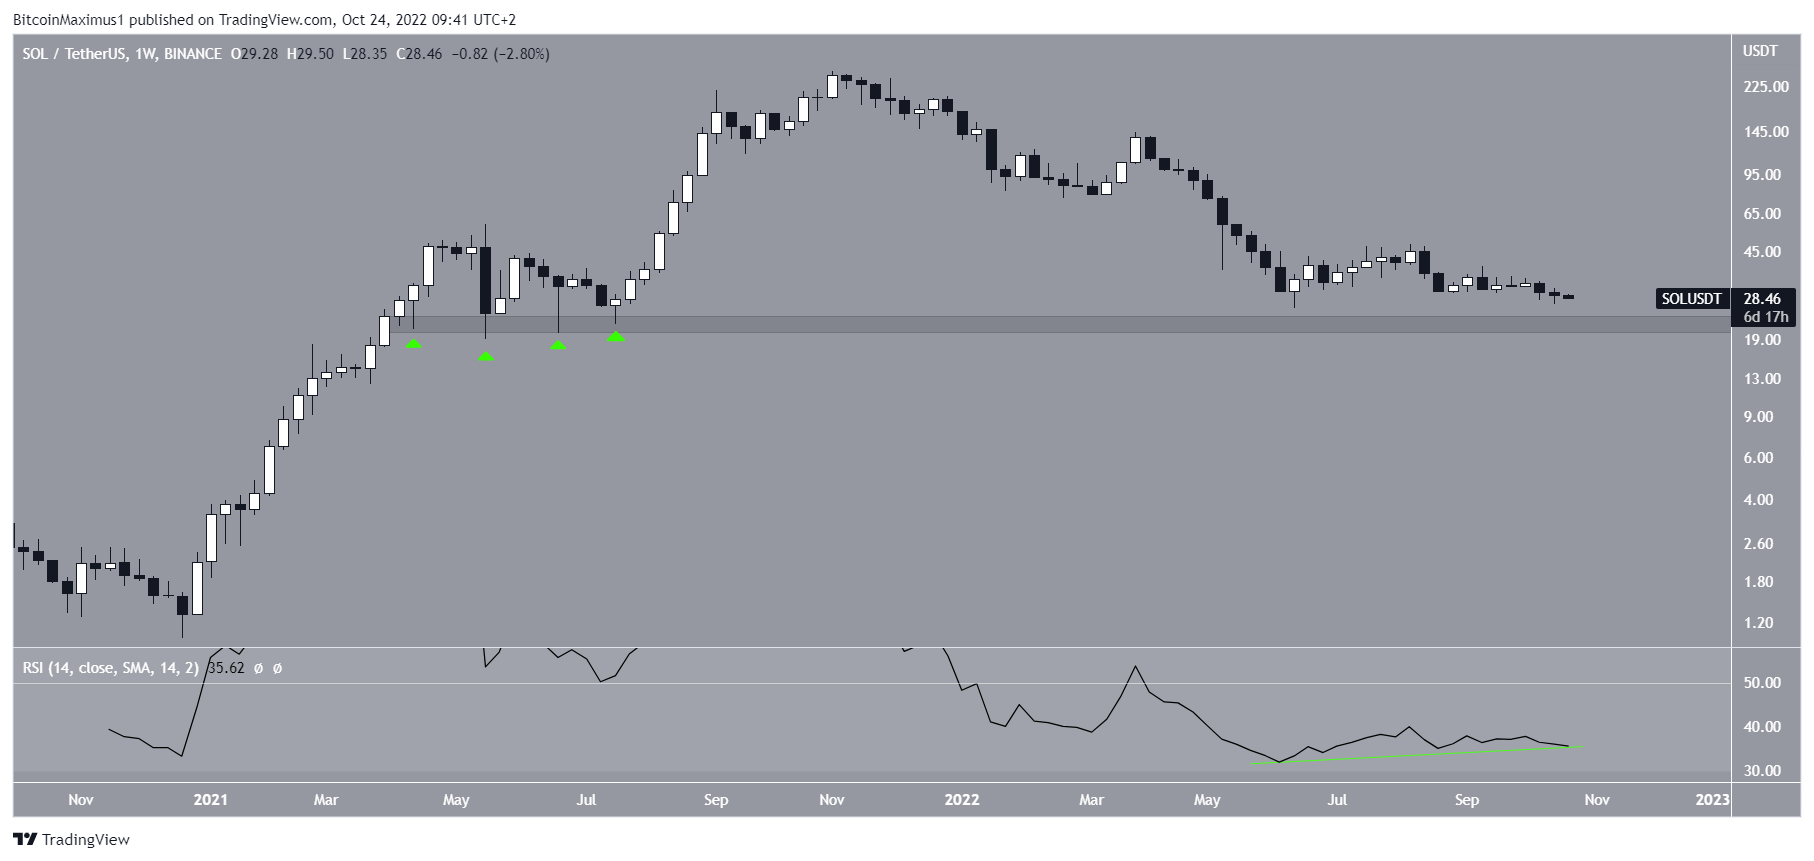
SOL/USDT Chart By TradingView
SOL Price Readies for Fifth Breakout Attempt
A technical analysis on the daily Solana price chart shows that SOL has been following a descending resistance line since Aug. 13. So far, the line has been validated four times.
Since lines get weaker each time they are touched, the price action states that an eventual breakout from the line is likely.
There are two other factors that support the possibility of a SOL price breakout: The bullish divergence in the daily RSI (green line) and the reclaim of the minor $28.25 support area.
If a breakout transpires, the closest resistance area would be at $37.65. This is the 0.5 Fib retracement resistance level (white) and a horizontal resistance area.
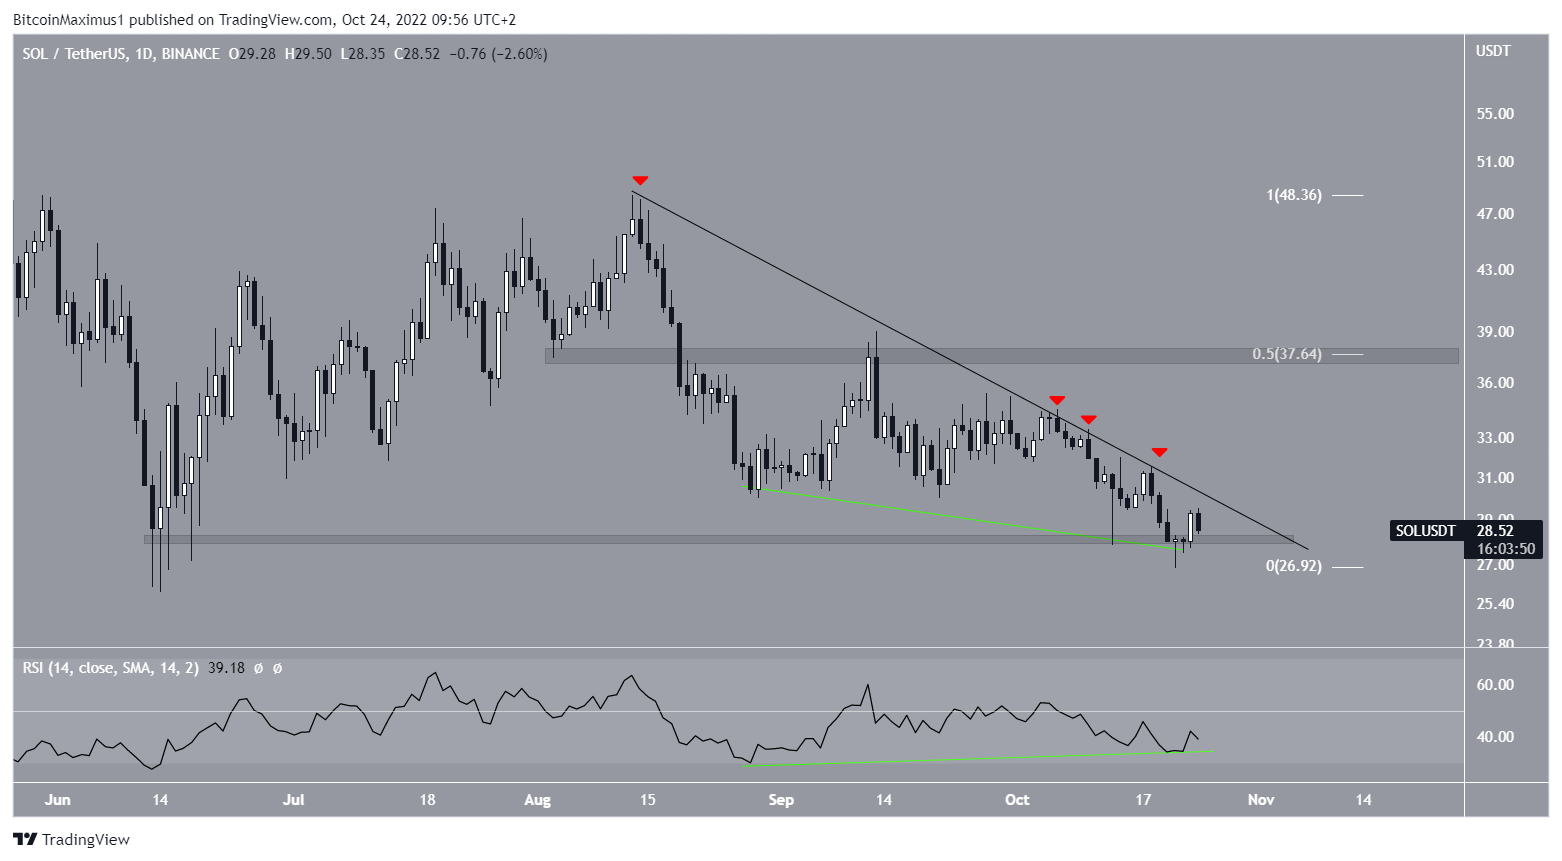
SOL/USDT Chart By TradingView
Future Price Trend Unclear
It is important to note that despite the bullishness from the daily time frame, the indecision of the weekly chart leads to an undetermined trend.
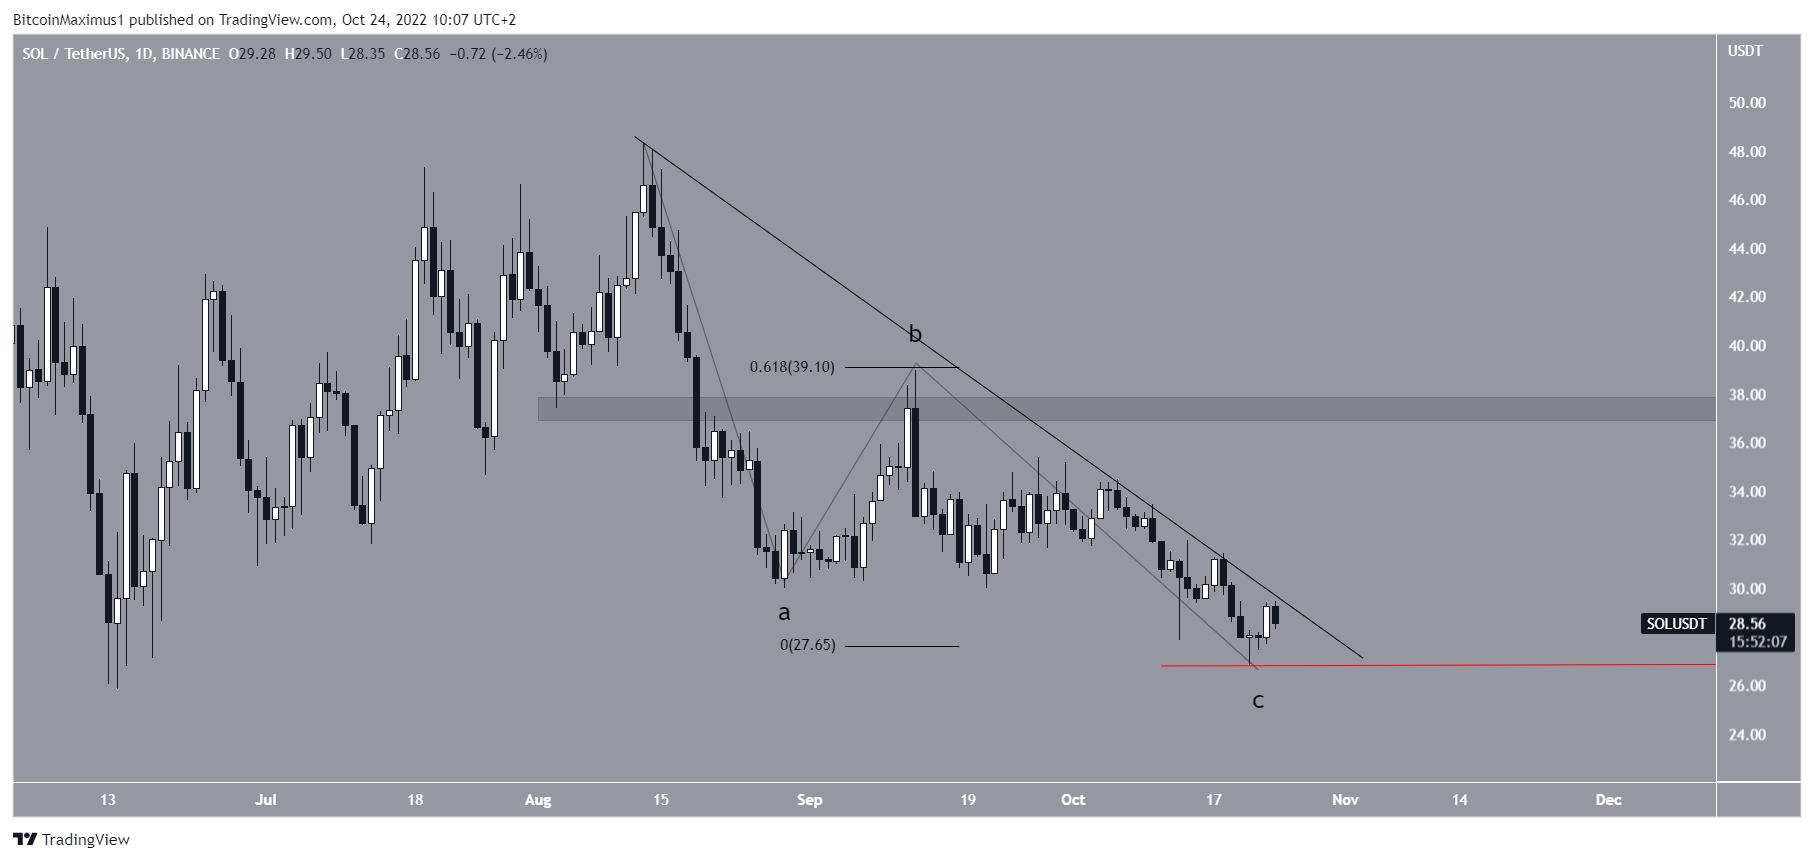
In the daily time frame, it seems that the SOL price has completed an A-B-C corrective structure in which waves A:C have had a 1:0.618 ratio. This is in line with the bullish readings that support the breakout.
Afterward, a reclaim of the aforementioned $37.65 resistance area would go a long way in suggesting that the long-term trend is bullish.
Alternatively, a decrease below the Oct. low of $26.84 (red line) would indicate that the trend is bearish instead, and a new yearly low is expected.
SOL/USDT Chart By TradingView
Disclaimer: BeInCrypto strives to provide accurate and up-to-date information, but it will not be responsible for any missing facts or inaccurate information. You comply and understand that you should use any of this information at your own risk. Cryptocurrencies are highly volatile financial assets, so research and make your own financial decisions.
Sourced from cryptonews.net.