
Analytics
cryptoknowmics.com
07 October 2022 12:11, UTC
Reading time: ~2 m
The NEAR Technical Analysis shows a struggle to start an uptrend within the falling wedge pattern as it consolidates near the crucial support level of $3.5. The NEAR price action displays a lateral trend at the $3.5 support level resisting the bull cycle to gain momentum. Furthermore, the recent increase in selling pressure warns of a downtrend, retesting the support trend line. So, should you consider capturing the selling opportunity in hopes of a bearish fall?
Key Points:
- The Near Protocol price action shows a bullish failure to sustain the uptrend reversing from the support trendline.
- The increased selling projects the possibility of a bearish breakout of the falling wedge in the daily chart.
- The intraday trading volume in Near Protocol is $134 million.
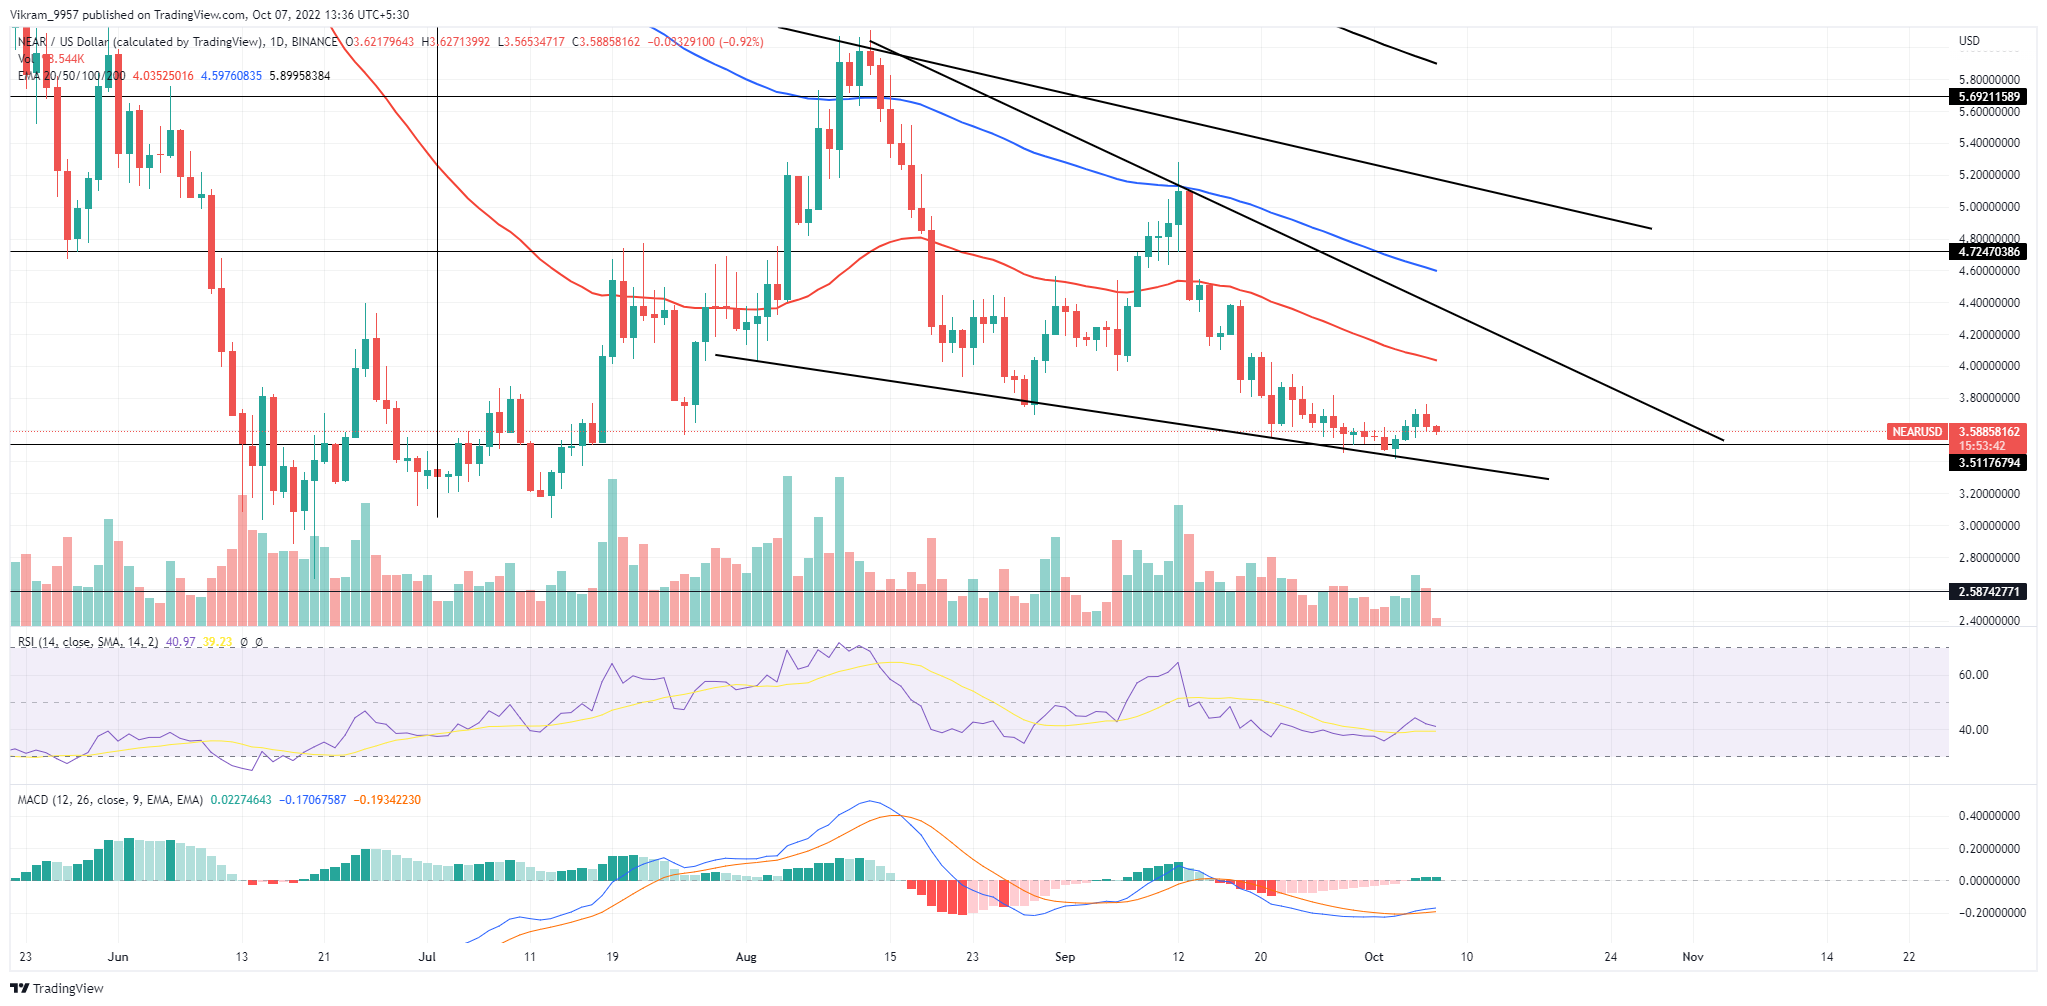 Source – TradingView
NEAR Technical Analysis
As we mentioned in our previous analysis, the NEAR price action exhibits a bullish reversal from the support trendline of the bearish wedge pattern. Furthermore, the bullish reversal rally accounts for a 7.5% jump in a week leading to a streak of bullish candles. However, the NEAR price action displays a 3% drop in the last 48 hours due to the rejection from the $3.70 mark. Additionally, the spike in trading volume supports the higher price rejection increasing the possibility of a $3.5 breakdown. If the buying pressure fails to regain momentum downtrend below the 3.5 dollars mark will inevitably break the support trendline giving a breakout. A daily candle closing below the support trendline will signaller selling opportunity to sideline traders with the potential of a 10% drop to the psychological mark of $3. Conversely, the bullish reversal will be the overhead resistance of the 50-day EMA at $4, accounting for a price jump of 15%.
Technical Indicators
The RSI slope shows a lateral trend in the nearly oversold zone above the 14 days average line. Moreover, the fast and slow lines continue the uptrend after the recent crossover event, neglecting the daily chart’s shortcomings. Therefore, the technical indicators highlight a solid underlying bullishness. As a result, the NEAR technical analysis signals a buying opportunity at the current market price. Resistance Levels – $4 and $4.5 Support Levels – $3.5 and $3
Sourced from cryptonews.net.