

Analytics
cryptoknowmics.com
07 October 2022 12:25, UTC
Reading time: ~2 m
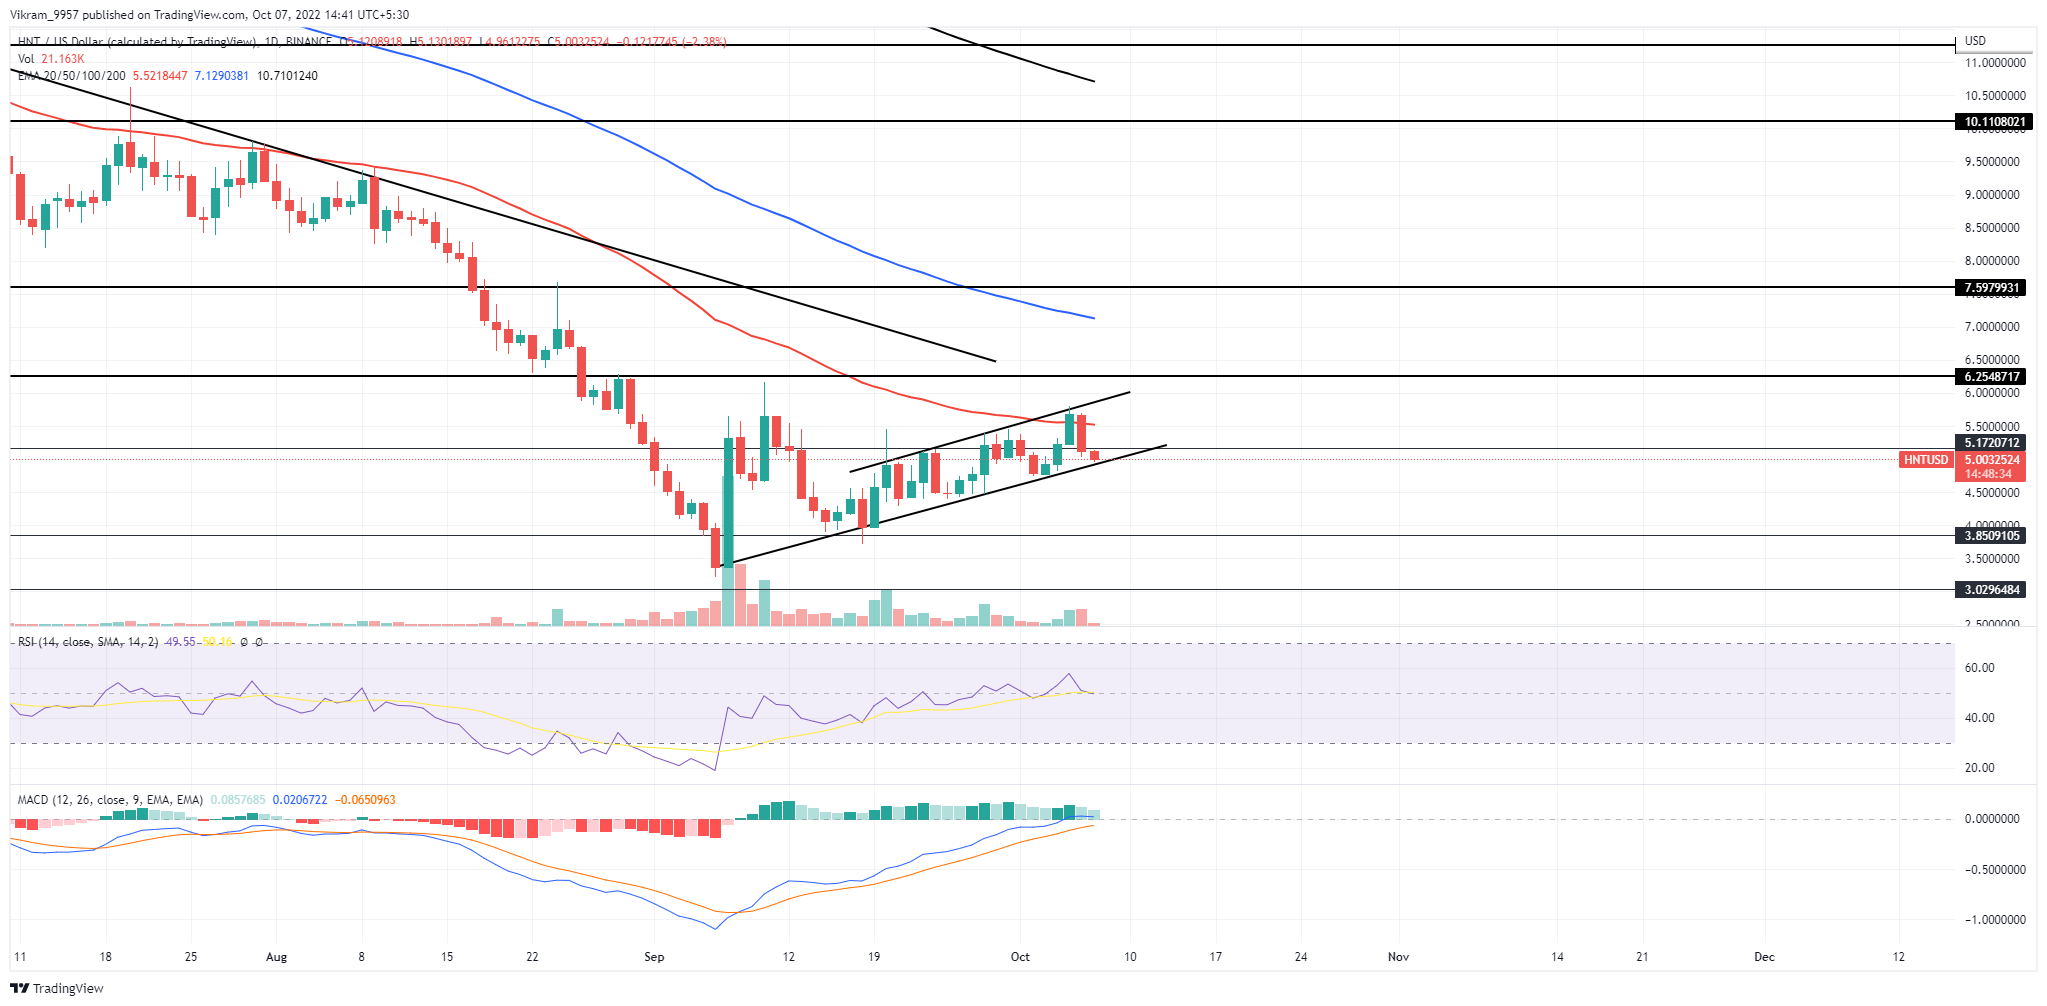
The HNT Technical Analysis shows a bullish reversal from $3.3 rising within a parallel channel. However, the recent bear cycle warns of a downfall. The HNT price action shows a rising channel pattern in the daily chart accounting for price and for 48% over the last month. However, the recent increase in selling pressure after reversing from the 50-day EMA increases the possibility of a bearish breakdown. So, should you consider booking your profits?
Key Points:
- The Helium price action shows an increase in supply at the 50-day EMA, knocking down the bull cycle.
- The bearish divergence in the RSI slope projects the possibility of a bearish breakdown.
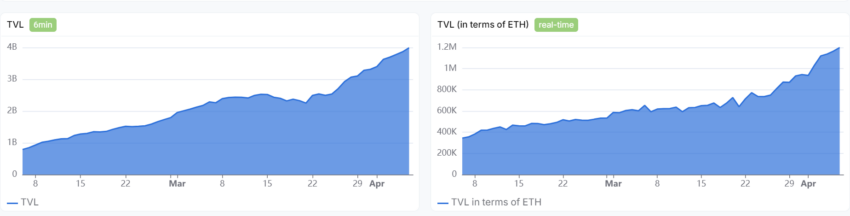
- The intraday trading volume in Helium is $31.36 million.
 Source – TradingView
HNT Technical Analysis
As we mentioned in our previous analysis, the HNT price action exhibits a bullish breakout of the symmetrical triangle pattern leading to a rising channel. The bull cycle breaks about the psychological mark of $5, but the overhead resistance of the 50-day EMA restarts the bear cycle. Currently, the Helium price action displays a 12% drop in market value in the last 48 hours due to the rejection from the resistance trendline. Moreover, the spike in the intraday trading volume supporting the bearish engulfing candle increases the likelihood of a bearish breakdown. If the selling pressure increases, the Helium price action will offer a bearish breakdown entry opportunity to sideline traders. The breakout rally will breach the $4.5 mark to test the horizontal support level at $3.85. Conversely, the bullish reversal will reach the overhead resistance of the 50-day EMA and the declining trendline at $6.
Technical Indicators
The RSI slope shows a rising trend breaking above the halfway line with the support of the 14-day SMA reflecting a solid underlying bullishness. Moreover, the fast and slow lines sustain an uptrend to reach the zero line but the declining trend in bullish histograms warns of a bearish crossover. Resistance Levels – $55 and $6 Support Levels – $5 and $4.5
Sourced from cryptonews.net.