
BTC/USD Tests 20584 Technical Support: Sally Ho’s Technical Analysis – 8 November 2022
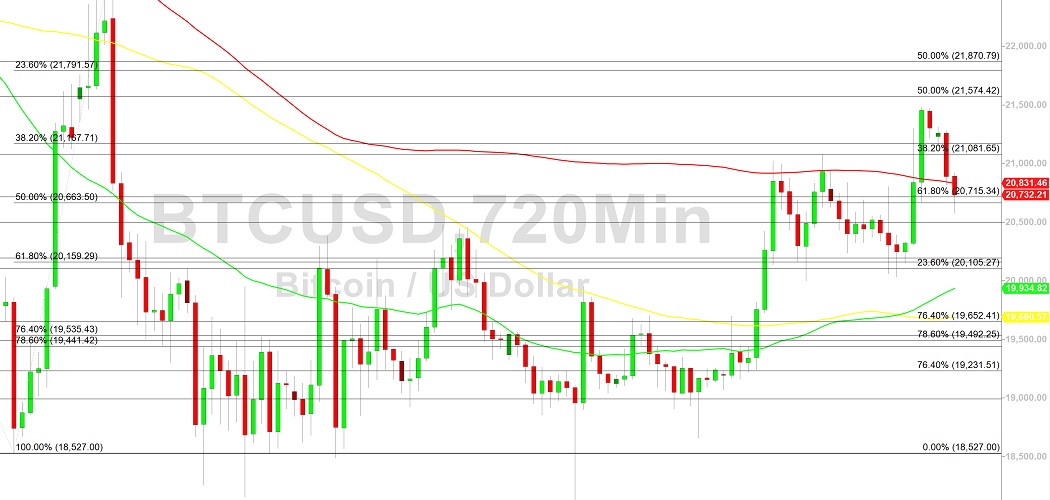
Bitcoin (BTC/USD) extended its ongoing pullback early in the Asian session as the pair traded as low as the 20575.02 level, representing a test of the 61.8% retracement of the recent appreciating range from 20032.02 to 21478.80. Additional downside retracement levels in this appreciating range include the 20373 and 20341 levels, below which Stops are building. Stops were elected below the 21137, 20926, and 20755 levels during the ongoing pullback, representing the 23.6%, 38.2%, and 50% retracements of the appreciating range. BTC/USD recently traded as high as the 21478.80 area, its strongest print since mid-September and a test of the 50% retracement of the broad depreciating range from 25214.57 to 18131. Additional upside retracement levels in depreciating ranges from the 48240, 32371, and 25214.57 levels include the 22508, 23542, 23579, 23698, 25236, 25251, and 26931 areas.
BTC/USD bears observe larger Stops accumulating below the 17803, 17701, 16966, and 16503 areas, significant technical levels related to historical upside pressure around the 3858 and 9819 levels. Additional significant technical areas on the downside include the 16990.14, 14500.15, and 10432.73 areas. Stops are also accumulating below the 19711 and 19355 areas. Traders are observing that the 50-bar MA (4-hourly) is bullishly indicating above the 100-bar MA (4-hourly) and above the 200-bar MA (4-hourly). Also, the 50-bar MA (hourly) is bullishly indicating above the 100-bar MA (hourly) and above the 200-bar MA (hourly).
Price activity is nearest the 50-bar MA (4-hourly) at 20679.73 and the 100-bar MA (Hourly) at 20798.15.
Technical Support is expected around 16990.14/ 14500.15/ 10432.73 with Stops expected below.
Technical Resistance is expected around 25256.96/ 27455.20/ 32383.96 with Stops expected above.
On 4-Hourly chart, SlowK is Bearishly below SlowD while MACD is Bearishly below MACDAverage.
On 60-minute chart, SlowK is Bullishly above SlowD while MACD is Bearishly below MACDAverage.
Disclaimer: Sally Ho’s Technical Analysis is provided by a third party, and for informational purposes only. It does not reflect the views of Crypto Daily, nor is it intended to be used as legal, tax, investment, or financial advice.
Sourced from cryptodaily.co.uk.
Written by Sally Ho on 2022-11-07 16:00:00.