
According to a recent Bloomberg report, a bearish rising wedge pattern indicates that Bitcoin, the world’s largest cryptocurrency, could face more losses.
When the aforementioned pattern is accompanied by declining trading volume, it usually means a continuation of the bearish trend.
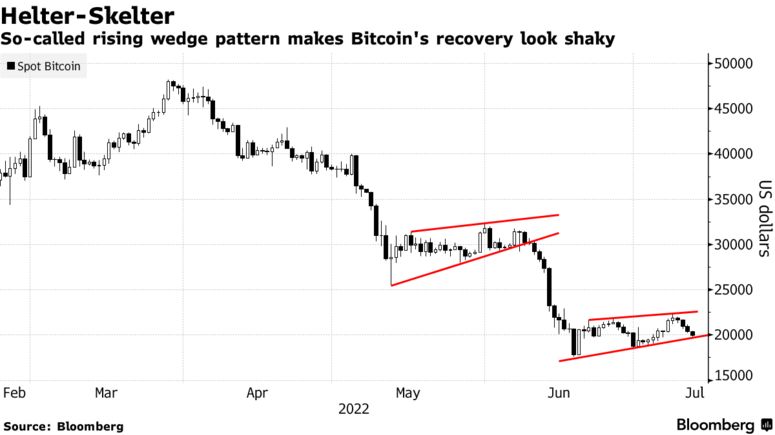
Notably, the same exact pattern was formed earlier during the second quarter. It was the harbinger of a 40% correction that brought Bitcoin as low as $17,600 last month. The cryptocurrency’s performance was so atrocious that it actually recorded its worst quarter in more than a decade.
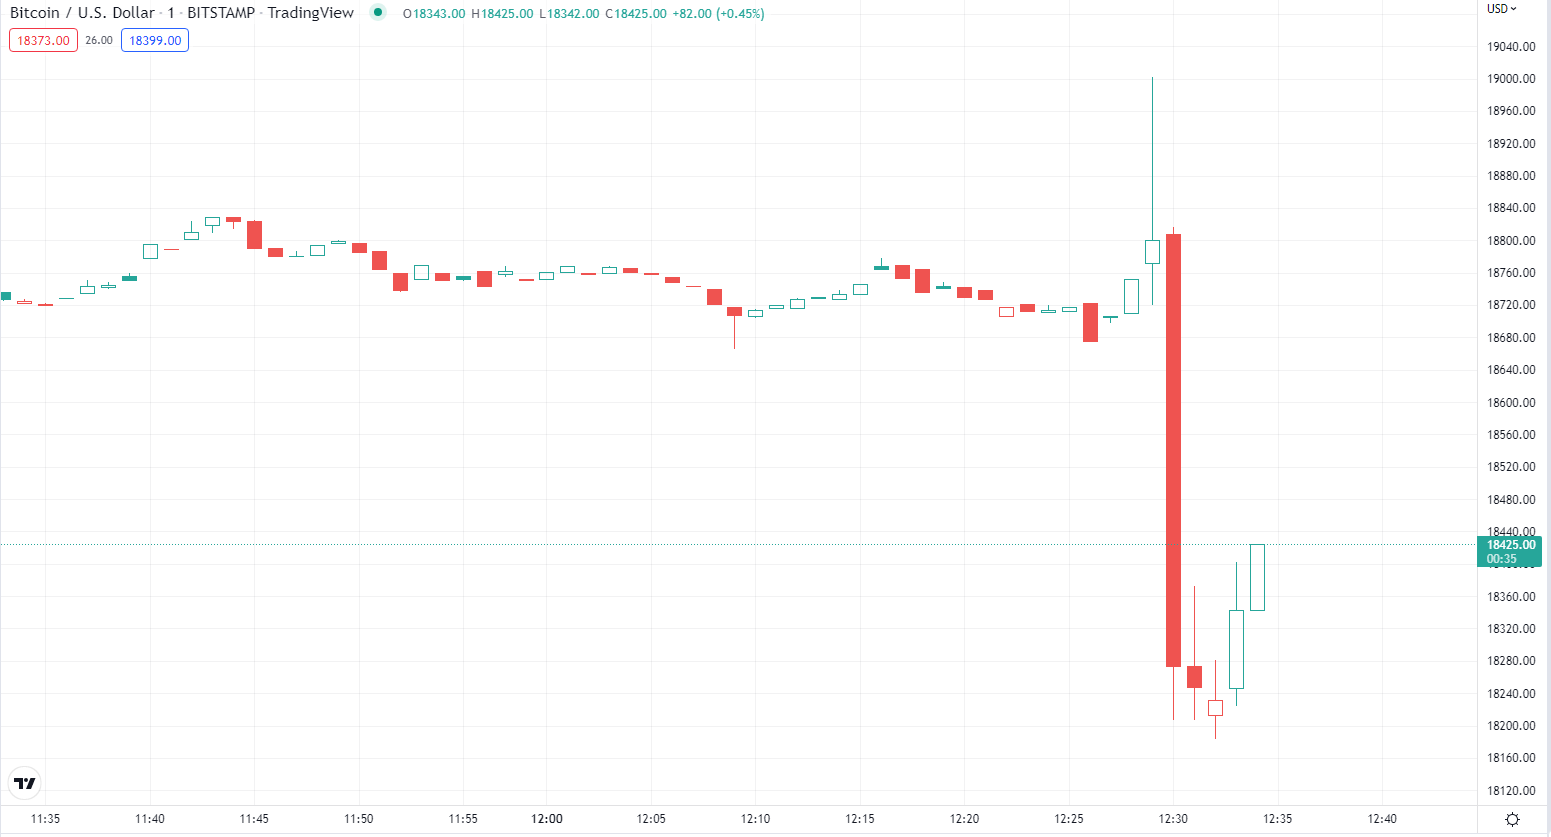
After Bitcoin managed to gain some ground last week, the Sunday sell-off threw a wrench in the works for bulls who hoped for an eventual recovery. Earlier today, the flagship cryptocurrency dipped to the $19,600 level.
If the current rising wedge pattern ends up playing out, Bitcoin will likely come closer to Scott Minerd’s uber-bearish price target of $8,000. The top crypto would have to top another 59% to reach that target.
As reported by U.Today, the Bloomberg MLIV Pulse survey showed that Bitcoin was likely to plunge to the $10,000 level, according to the majority of retail and institutional investors. Concerns about the U.S. Federal Reserve’s monetary tightening remain the main reason behind this persistent bearish pressure.
In the meantime, former BitMEX CEO has doubled down on his too-good-to-be-true $1 million price prediction after the euro came close to reaching parity with the dollar. He previously said that the largest cryptocurrency would be able to reach that target by 2030.
Sourced from u.today.
Written by Alex Dovbnya on 2031-10-21 09:38:07.